Forecast Products
HUXt Ensemble Forecast Dashboard
Select a combination of boundary conditions to view the corresponding forecast data. For help interpreting the forecast dashboard, please consult this guide.
These forecasts are still an experimental research product. They are provided here for interest, and we accept no responsibility for any decisions made based on them. Please contact us if you would like to use these forecasts for any purpose.
Latest Forecast
Latest Forecast Animation
This animation shows the latest HUXt forecast for the selected ambient solar wind and CME boundary conditions. The presented view looks down on Earth's orbital plane, i.e. approximately looking down on the north rotational pole of the Sun.
Forecast Guide
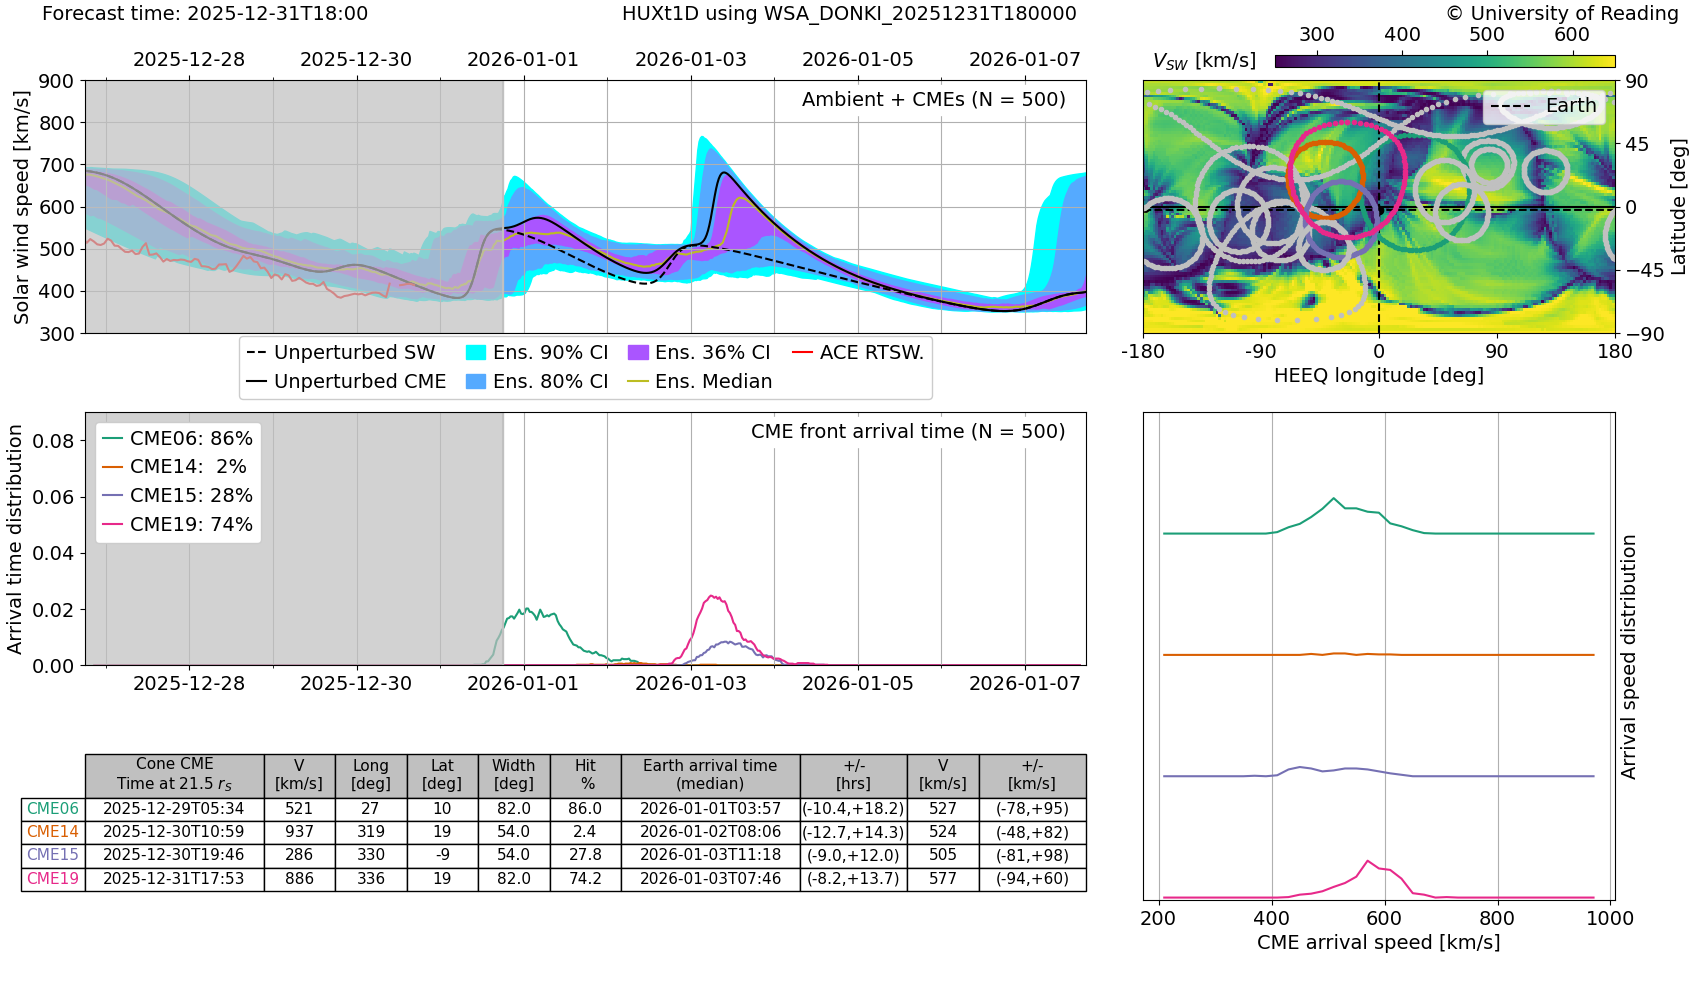
Below is an example of the forecast dashboard, using WSA for the ambient solar wind boundary condition and the DONKI M2M catalogue as the source of CME paramters.
The HUXt ensemble forecast takes two data inputs:
- Estimates of the solar wind speed close to the Sun at 21.5 rS.
- Estimates of CME properties (speed, direction, and width) at 21.5 rS.
Dashboard panel descriptions
Top-left: Time series of solar wind speed, for the model spin-up period (grey) and the forecast interval (white). The black line is the “deterministic” forecast – the HUXt run with the selected ambient solar wind boundary condtion and CME parameters, without any perturbation. The white line is the HUXt ensemble median, the blue and purple coloured bands are percentiles of the ensemble. When the bands are narrow or broad, the forecast has high or low confidence, respectively. The observed real-time solar wind speed from ACE is shown in red for the last 5 days.
Middle-left: Time series of CME arrival probability at Earth. It is the fraction of ensemble members that predict a particular CME will arrival at Earth within a particular time window. The total area under a given curve is a measure of the confidence that CME will arrive at Earth. A narrower peak suggests higher confidence in the arrival time. A broader peak suggests lower confidence in the arrival time.
Bottom-left: Table of the Earth-directed CME properties and forecast arrival times and speeds.
Top-right: Summary of the input data. The colour map shows the selected ambient solar wind speed boundary conditions at 21.5 rS, in HEEQ coordinates. Overlaid are the positions and widths of CMEs from the selected source of CME data. Those with a possibility of Earth impact are assigned a colour which is used consistently across these panels.
Bottom-right: The probability density of CME arrival speeds, for the Earth-impacting CMEs only. A narrower peak suggests higher confidence in the arrival speed, while a broader peak suggests lower confidence in the arrival speed.